Decarbonisation, or reducing carbon dioxide (CO2) levels, is central to tackling climate change. For businesses, understanding and reporting carbon emissions contributes to their overall carbon footprint, which reflects their environmental impact. However, most companies often struggle to determine which emissions to report.
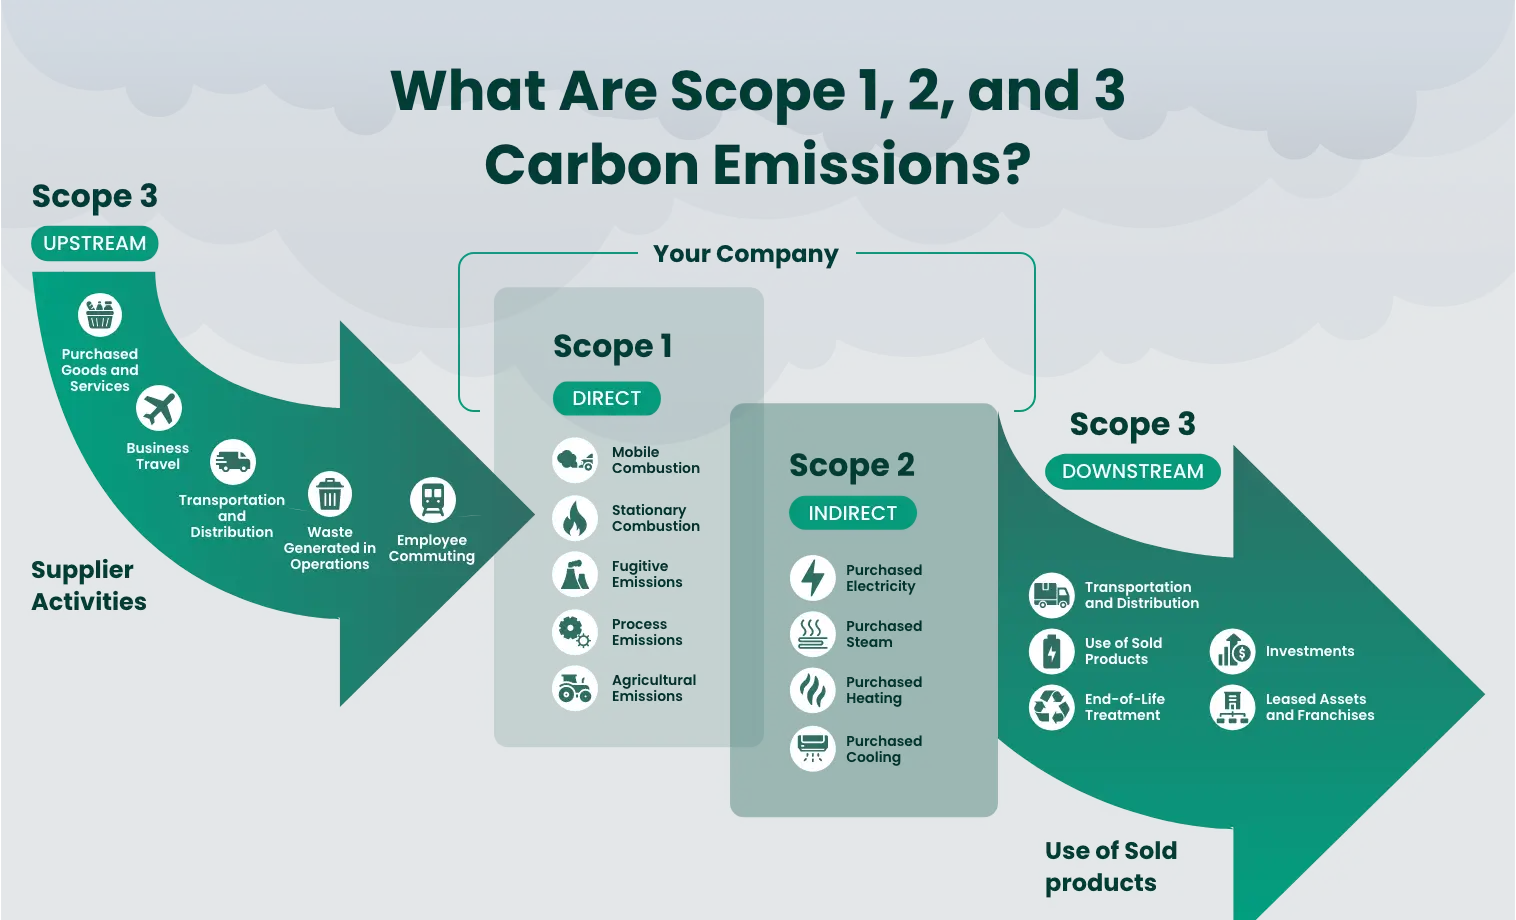
According to the GHG Protocol, carbon emissions are to be classified under scope 1, 2, 3 emissions, based on who is ultimately responsible for their release into the atmosphere. Under most carbon emissions reporting standards and legal frameworks, only scopes 1 and 2 must be reported, although there is growing support for expanding standards to include scope 3.
Additionally, the GHG Protocol allows businesses to utilise tools, like carbon footprint calculators and sustainability or ESG reporting software, to track and manage these carbon emissions.
What are scope 1 emissions?
Scope 1, or direct emissions, are greenhouse gas emissions from sources a company owns or directly controls. These emissions are produced through on-site activities or operations, making them the most immediate and tangible form of emissions for businesses to address. While scope 1 covers direct emissions, there are certain exclusions to note. Scope 1 includes the 7 gases listed under the Kyoto Protocol. Gases not covered by the Kyoto Protocol, such as chlorofluorocarbons (CFCs) or nitrogen oxides (NOx), should also be excluded from scope 1 reporting and listed separately.
Examples of Scope 1 Emissions
Scope 1 emissions can be grouped into several main categories, highlighting the different ways businesses directly contribute to greenhouse gas emissions:
- Mobile Combustion: These emissions come from vehicles and equipment that run on fuel and are operated by the company. Think of delivery vans, maintenance trucks, or forklifts used in warehouses or on job sites. Any use of vehicles or mobile equipment movement within company control falls under this category.
- Stationary Combustion: Emissions in this group are produced by burning fuel in stationary or fixed equipment like boilers, furnaces, and emergency generators. These are common in factories, office buildings, or any facility that uses fuel to keep operations running or buildings powered.
- Fugitive Emissions: These are gases that escape unintentionally or go unnoticed during operations. This includes leaks from refrigeration systems or pipelines carrying gas. Even small leaks from electrical equipment can lead to massive emissions over time, especially with potent GHGs like sulphur hexafluoride, which is commonly used as an insulating gas.
- Process Emissions: Chemical reactions during industrial activities release these gases. For instance, making cement, glass, or steel often produces carbon dioxide as a byproduct. These emissions are not from fuel use but from the materials themselves that are changing in the process.
- Agricultural Emissions: These emissions come from agricultural operations directly managed by the business. Common sources include methane that is released by cows during digestion and nitrous oxide from soil that is treated with synthetic or natural fertilisers. These natural processes release large amounts of greenhouse gases when scaled up for intensive farming.
How are scope 1 emissions calculated?
1. Identify emission sources: List all direct emission sources under the company’s control. This includes:
- Vehicles and machinery that burn fuel
- Boilers, furnaces, or generators on-site
- Chemical processes that produce CO₂
- Equipment prone to gas leaks, like HVAC systems
2. Collect activity data
Measure how much fuel is burned, how much material is processed, or how much gas has leaked. Activity data is usually tracked in units like litres, gallons, kilogrammes, or cubic metres. Examples include:
- Litres of fuel used in company vehicles
- Kilogrammes of refrigerant gases lost
- Tonnes of cement produced
3. Use emission factors for the emissions formula: Multiply the activity data by emission factors, which are standard values that estimate emissions per unit of activity. These factors are provided by organisations like the Intergovernmental Panel on Climate Change (IPCC) or national agencies.
- Example: 100,000 kWh × 0.5 kg CO₂e = 50,000 kg CO₂e (or 50 tonnes)
4. Summarise and report
Add up emissions from all sources to get the total scope 1 emissions. Report the data according to recognised frameworks like the GHG Protocol.
What are scope 2 emissions?
Scope 2 emissions, or indirect emissions, result from generating energy purchased and consumed by a company. These emissions occur outside the organisation’s physical operations but are directly tied to its energy use. The most common sources include greenhouse gases produced during the generation of electricity, heating, cooling, or steam that a company procures to power its facilities.
While scope 2 emissions are generated off-site, businesses are still accountable for them as they depend on external suppliers for their energy needs. Reducing scope 2 emissions often involves improving energy efficiency and sourcing renewable or low-carbon energy alternatives.
Examples of Scope 2 Emissions
Scope 2 emissions primarily stem from purchased energy sources that power operations:
- Purchased Electricity
Emissions resulting from the production of electricity consumed by an organisation, whether for offices, manufacturing plants, or warehouses. - Purchased Steam
Emissions generated during the production of steam used for industrial processes or heating systems. - Purchased Heating
Emissions tied to energy produced for heating purposes, such as district heating systems serving office buildings. - Purchased Cooling
Emissions related to energy consumed for cooling purposes, such as district cooling systems or central air conditioning supplied externally.
How are scope 2 emissions calculated?
Scope 2 emissions are calculated by multiplying the energy consumed by its corresponding emission factor, which represents the greenhouse gases emitted per unit of energy generated. Here’s a simplified approach:
1. Add up your energy use: Gather data on all purchased electricity, steam, heating, and cooling used over a certain period. This is usually in kilowatt-hours for electricity.
2. Find the right emissions factor: This number shows how much carbon is released per unit of energy in your region, which can be based on reliable databases such as the Environmental Protection Agency (EPA). You can categorise using these factors:
- Location-based or from your local energy grid
- Market-based, if you purchase green and renewable energy
3. Do the math: Multiply your total energy use by the emission factor. Use the general emissions formula similar to the one used in scope 1.
- Example: 100,000 kWh × 0.5 kg CO₂e = 50,000 kg CO₂e (or 50 tonnes)
What are scope 3 emissions?
Scope 3 emissions include all indirect greenhouse gases that occur in a company’s value chain but are not directly produced or controlled by the organisation. Unlike the first two scopes, scope 3 emissions encompass a broad range of activities, both upstream and downstream. These emissions arise from processes like material extraction, manufacturing, transportation, product use, and disposal.
As scope 3 emissions often represent the largest portion of a company’s total carbon footprint, companies must work closely with suppliers and partners to reduce these emissions, which are divided into two:
Upstream Emissions
Upstream emissions are generated from processes and activities that occur before a company’s direct operations, such as material sourcing, production, and transportation of goods or services:
- Purchased goods and services: Emissions from the production of raw materials, components, or services purchased by the company.
- Business travel: Emissions generated from employee travel, such as flights, trains, and car rentals.
- Transportation and distribution: Emissions from transporting goods and materials to the company, including suppliers’ logistics.
- Waste generated in operations: Emissions from waste disposal, including recycling and landfill processes.
- Employee commuting: Emissions produced by employees travelling to and from work.
Downstream Emissions
Downstream emissions result from activities that occur after a product or service has left a company’s control, such as product distribution, use, and disposal:
- Transportation and distribution: Emissions from distributing and delivering finished products to customers.
- Use of sold products: Emissions that arise when customers use the products, such as fuel consumption in vehicles.
- End-of-life treatment: Emissions resulting from the disposal, recycling, or incineration of sold products.
- Investments: Emissions associated with investments and financial activities, such as portfolios or holdings.
- Leased assets and franchises: Emissions from leased facilities, vehicles, or franchised operations not included in scope 1 or 2.
How can organisations across industries reduce carbon emissions?
Reducing emissions starts with how companies manage energy use and emissions from both direct and indirect sources. Here are a few ways companies can cut back on these emissions:
Use less energy with smarter systems
Upgrading to LED lights and Energy Star-certified equipment can cut electricity use significantly. LEDs last longer and lower energy use by nearly 90% compared to traditional bulbs, while efficient appliances reduce day-to-day power needs.
Improve HVAC performance
Heating and cooling systems use a large share of office energy. Regular maintenance, smart thermostats, and improved insulation can minimise waste and help maintain comfortable conditions at no additional cost.
Shift to renewable power
Installing solar panels or buying green electricity from certified providers reduces reliance on fossil fuels. Apple now powers all of its offices with clean energy, contributing to the over 18 gigawatts of renewable power to support its operations and supply chain.
Rethink office routines
Remote or hybrid work setups cut commuting emissions and reduce energy use in office spaces. Spotify’s remote-first policy has helped shrink its office footprint and lowered travel-related emissions.
Measure and act
Running a carbon footprint assessment helps businesses find the biggest emissions sources and track progress with the use of advanced technology, such as ESG software that can calculate, automate, and offer actionable insights.
How can organisations reduce scope 3 emissions?
Scope 3 emissions are often the most challenging to manage because they come from indirect sources that lie outside a company’s direct operations. But it is also the most impactful among the three. It takes up around 90% of their total emissions, and most of it lies beyond direct control.
Work with sustainable suppliers
Collaborating with suppliers that prioritise low-carbon materials and processes can lead to substantial upstream reductions. Businesses can request emissions data, require disclosures, and use sustainable procurement criteria in contracts.
Design for sustainability
Products and energy sources that are energy-efficient, recyclable, or longer-lasting generate fewer emissions across their lifecycle. Circular design principles can reduce both production and post-use emissions.
Encourage low-carbon workplace practices
Hybrid work, public transit incentives, and sustainable travel policies can reduce emissions from commuting and business travel, which are included in scope 3.
Optimise transport and logistics
Shift to low-emission vehicles, consolidate shipments, and optimise routes with lower emissions from freight, which is often a major part of the scope 3 category for many industries.
Offset what you can’t yet eliminate
Verified carbon offset programmes, such as reforestation or clean energy projects, offer a bridge for unavoidable emissions while reductions are still underway.
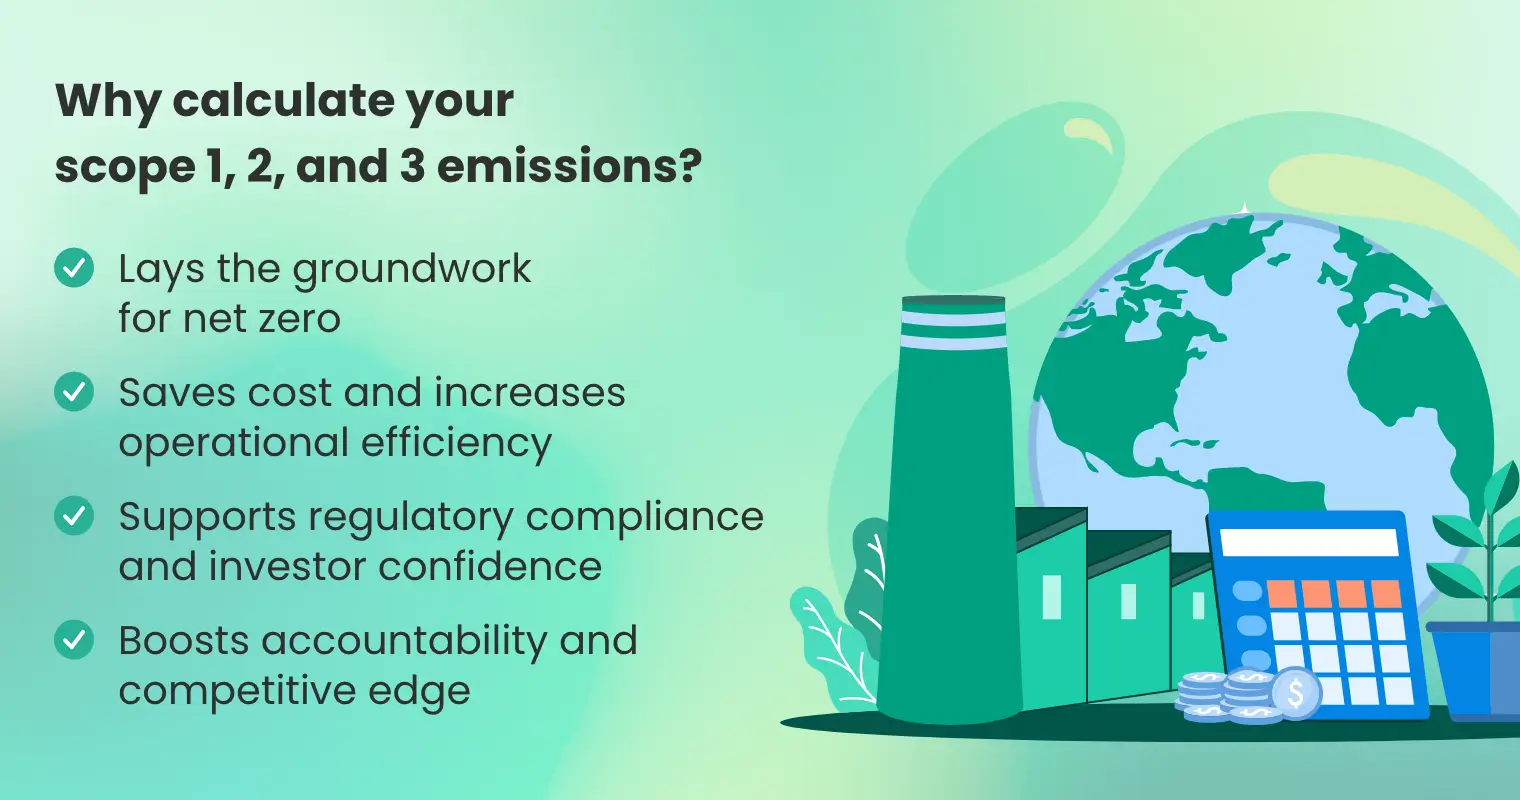
Why calculate your scope 1, 2, and 3 emissions?
Understanding your GHG emissions can be considered the foundation of any credible climate strategy. As businesses target carbon neutrality or net zero, the first and highly critical step is measuring the amount of emissions they emit. Now let’s look more into the whys.
Lays the groundwork for net zero
You can’t reduce what you haven’t measured. Tracking emissions across all scopes helps companies identify where they are coming from and build realistic, targeted plans to cut or avoid them.
Saves cost and increases operational efficiency
Emissions data and assessment often reveal inefficiencies and possible risks that can result in costly disruptions and preventable fines. Companies can use these insights to optimise energy use, cut waste, and save money, all while lowering their environmental impact.
Supports regulatory compliance and investor confidence
With the EU’s Corporate Sustainability Reporting Directive (CSRD) now covering around 50,000 companies and countries like Singapore, Hong Kong, and China tightening ESG disclosure rules, mandatory reporting is gaining traction and demand. Meeting these standards and compliance also strengthens a company’s transparency and competitive credibility.
Boosts accountability and competitive edge
Clear emissions breakdowns assign responsibility across the value chain of a company and show leadership in sustainability. This results in better trust among stakeholders, especially suppliers and partners. It also attracts talent and opens up new market opportunities.
FAQs about scope 1, 2, 3 emissions
1. What are the main differences between scope 1, 2, and 3 emissions?
Scope 1 covers emissions from sources a company directly owns and controls. Scope 2 comes from electricity and energy a company buys. Lastly, scope 3 emissions include everything else in the value chain, like supplier emissions and a customer’s entire use of the product.
2. Which type of emissions is the hardest to cut?
Scope 3 emissions are the hardest to cut because they involve external factors, including suppliers and how customers use products. These are things a company does not have full control of.
3. Do companies have to report scope 3 emissions?
It depends on the regulations in each country. In some places, like the EU, new laws are expected to make scope 3 reporting mandatory soon.
Measuring and Reporting Scope 1, 2, & 3 Emissions with Convene ESG
Monitoring scope 1, 2, and 3 emissions is essential to your company’s sustainability, but it can also be challenging. That’s where Convene ESG comes in. Convene ESG is an ESG software that gives users the ability to understand, measure, and report their carbon output, while also identifying strategies for reducing emissions across all scopes.
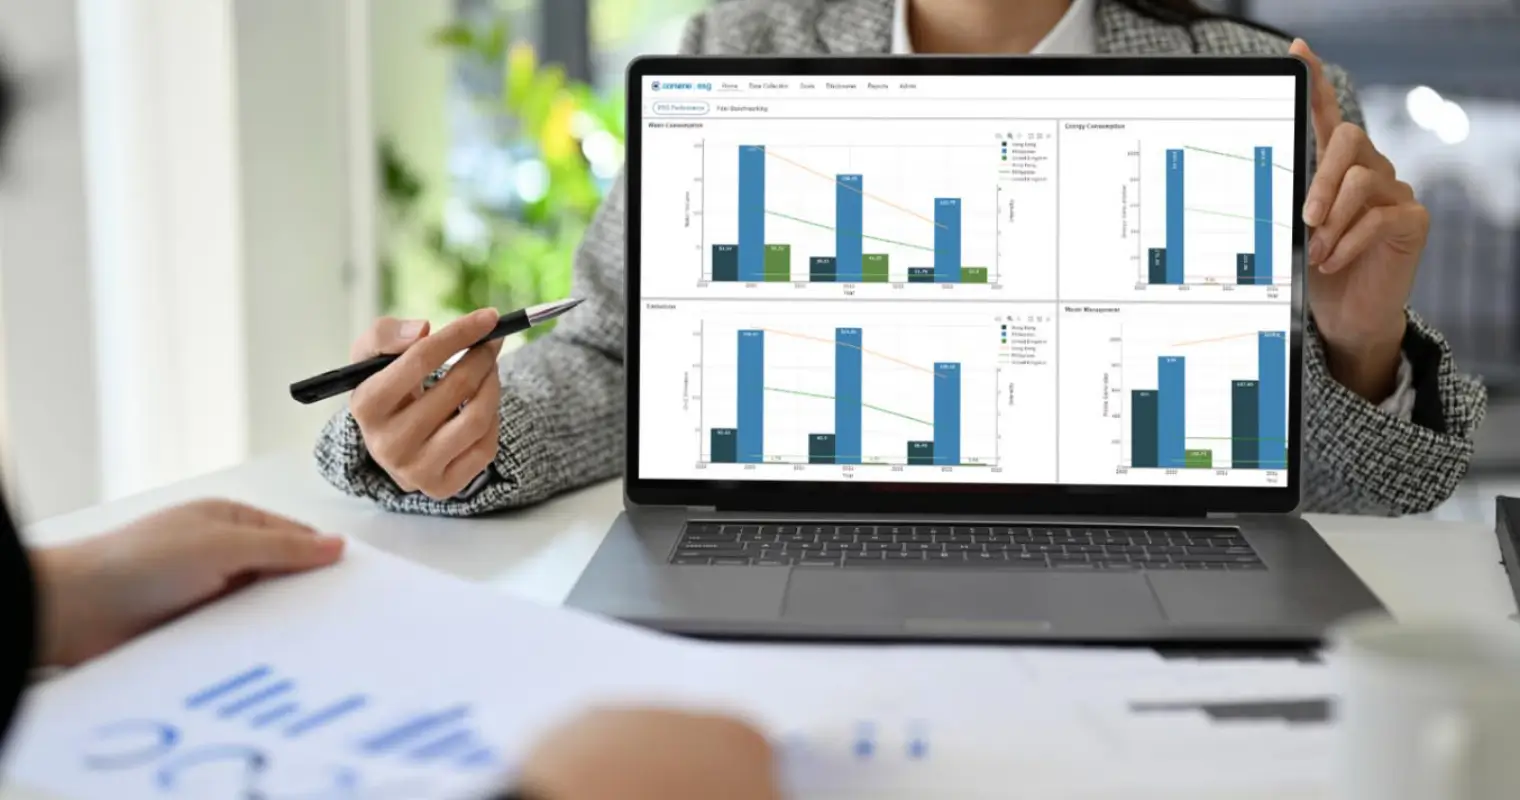
Convene ESG simplifies ESG reporting with automated data workflows, customisable reporting templates, and full compliance with mandatory requirements. Its dashboards track performance, set goals, and provide oversight to ensure transparency, all while adapting to evolving ESG reporting needs. It also measures scope 1, 2, and 3 emissions using global standards and customisable emission factors, offering a comprehensive scope emissions dashboard for easy tracking and reporting. For a faster way to estimate emissions, its carbon calculator also lets users input basic company information and instantly get a snapshot of their scope 1, 2, and 3 carbon footprint, using local emission factors.
Schedule your demo today to learn more about the leading ESG reporting software, Convene ESG.
Pat is a Content Writer, focusing on informative and purposeful content for Convene ESG. She has written for sustainable living and art exhibitions, and took part in research and communication projects linked to the UN's Sustainable Development Goals, further diving her into sustainability and ESG values. Outside of marketing and content, she explores new subjects in film, drawing, and occasional overthinking.
- Connect:
-

-